Subscribe
New Census Data Shows Historic Population Slowdown: Analysis
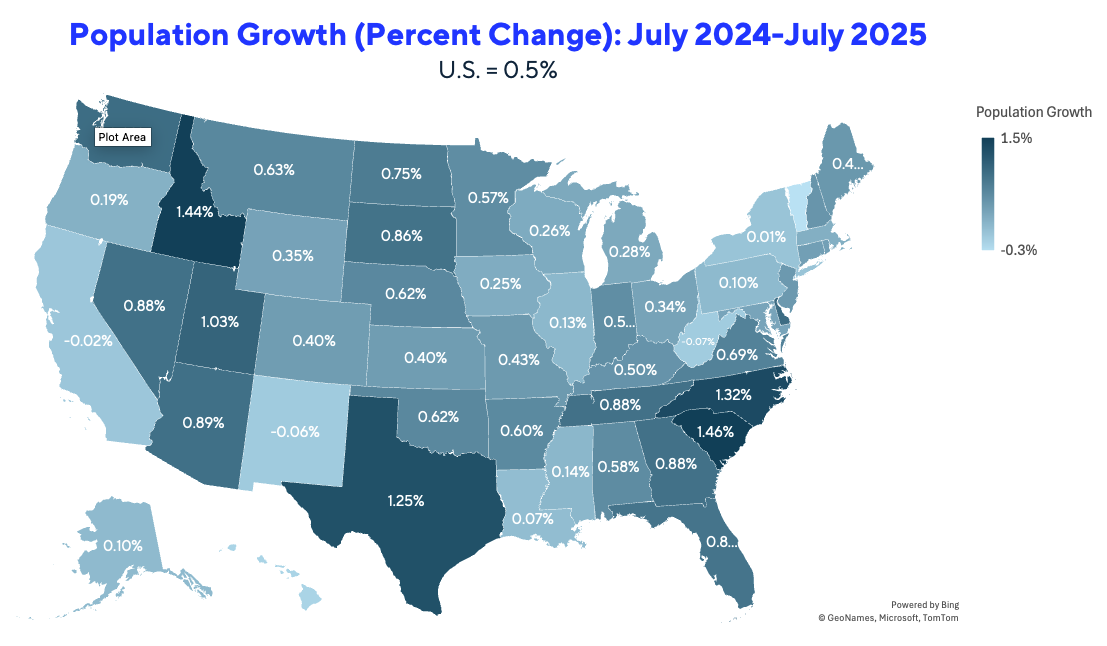
Fresh Census data shows U.S. population growth decelerated sharply to just 0.5% in the 12 months ending July 2025, driven by a record decline in international migration and a slowing birthrate. A SitusAMC analysis found notable population shifts among states, with Florida and Texas decelerating while South Atlantic and Midwest states grew.
Excluding Covid-19, annual population growth has not been this sluggish since 1919, amid the Great Influenza pandemic. International migration tumbled by 1.3 million between July 2024 and July 2025, a 54% drop. Meanwhile the birthrate (births minus deaths) hovered around 519,000, continuing a two-decade decline.
South Carolina topped population growth among the states, followed by Idaho, North Carolina and Texas. The Midwest also showed strength, the only region in which every state recorded population growth. For many years real estate investment flows have followed population growth, with the Southeast and Southwest the magnets for capital. If the U.S. is experiencing a rejiggering of regional population growth trends, real estate investors will need to be savvy to new demographics.
Sources: Census Bureau, SitusAMC Insights
After Covid-19 Surge, Florida Population Slows
Though Florida’s population grew 0.9% in 2025, 60 basis points (bps) below its five-year average, it was the worst downshift among the states, by far. Texas, another populous state and frequent focus of institutional investors, saw population growth decline 20 bps relative to its five-year average, though its overall 2025 growth rate was still among the highest in the nation. Meanwhile, population growth is accelerating in many of the South Atlantic and Midwest states. Of the highly populous geographies, Illinois, Washington, D.C. and North Carolina are seeing the strongest growths relative to their five-year history.
Immigration Policy Driving Population Declines
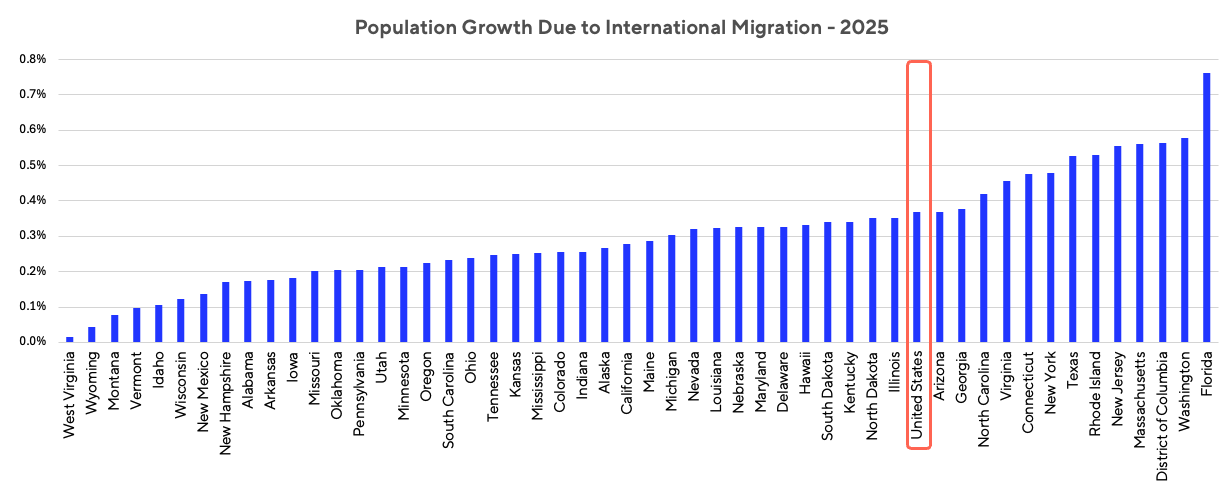
The sharp slowdown in immigration to the U.S. comes as little surprise, given it is a core policy goal of the Trump administration. All states experienced international outmigration between 2024 and 2025, particularly the West and New York. Florida saw the largest percentage of its population growth from international immigration, with 0.8% in 2025. Among more populous geographies, Washington, D.C. (up 0.6%), Texas (up 0.5%) and New York (up 0.5%) also saw large proportions of population growth attributable to this segment. Relative to their five-year history, most states are seeing a decline in population growth from international immigration. Except for North Carolina, the only states that saw this cohort accelerate have smaller populations, and are not typically targeted by institutional investors. (The Census Bureau does not distinguish between legal and illegal immigration.)
Sources: Census Bureau, SitusAMC Insights
President Trump’s mass deportation agenda targeting the more than 10 million unauthorized immigrants has significantly reshaped U.S. immigration dynamics. Since he took office, border crossings have fallen sharply, Immigration and Customs Enforcement (ICE) arrests have increased substantially and the detained population has reached record levels. These trends are unlikely to reverse. In May 2025, the administration raised ICE’s daily arrest target to 3,000 from 1,000. As a result, average daily arrests increased from to approximately 1,000 between June and October 2025, from roughly 650 between January and May 2025, the most available data.
Immigration detention has expanded rapidly. The detained population grew nearly 75% to 69,000 by January 8, 2026 from about 40,000 in January 2025, with the most people held in California, Texas, Louisiana and Florida. A growing share of immigrants are subject to mandatory detention while awaiting trial, a policy intended to encourage voluntary departure.
Together, these developments have reduced population growth and discouraged new immigration. In 2025, cumulative border crossings totaled roughly 180,000, down nearly 90% from 1.65 million in 2024 and 93% from 2.54 million in 2023.
The Sunshine State Falls From Favor
For commercial and residential real estate markets, domestic migration flows are an important demand driver: higher growth boosts the need for places to live, work and play. Domestic migration patterns have a sizeable impact on local economies and their growth potential, and largely reflect the attractiveness of states to workers and businesses.
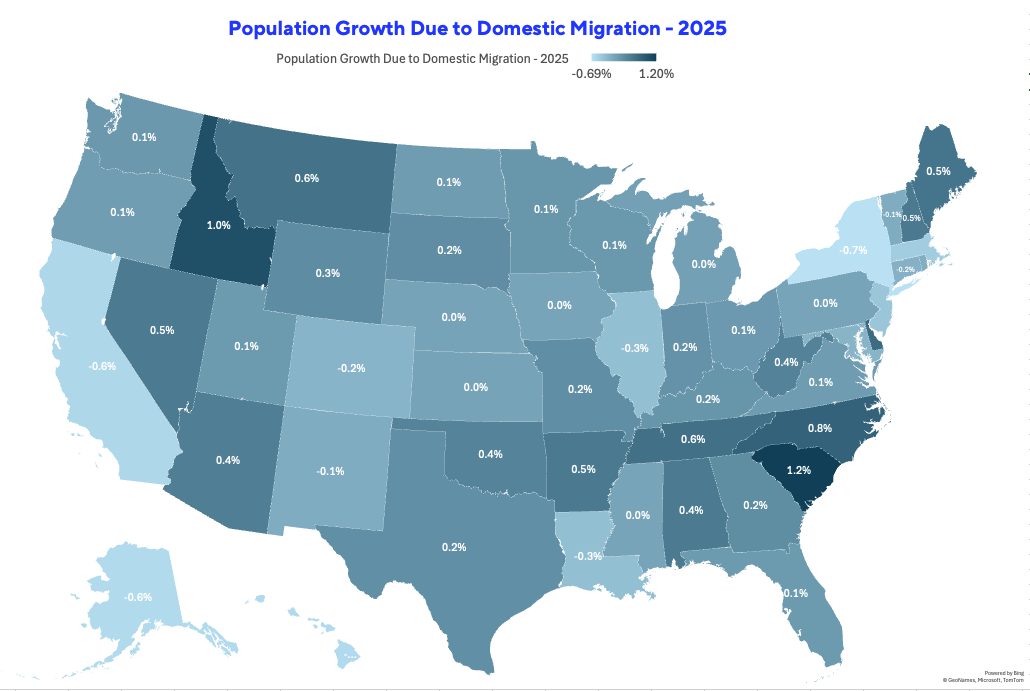
The early years of the COVID-19 pandemic saw an acceleration of many existing migration trends, with people moving out of highly populated and less affordable markets into Sun Belt states such as Florida and Texas. However, these trends appear to be ebbing. With strong population growth due to domestic migration, the Carolinas remain popular destinations. However, Texas and Florida had middling population growth from domestic migration in 2025. New York and California continued to experience domestic outflows.
Florida’s fall from grace is overt relative to its recent pace of population growth, with domestic migration only 0.1% in 2025, about one-third less than levels seen during the Covid-19 drop in 2020. Compared to its five-year average, Florida led the nation in deceleration of population growth from domestic migration. A few other Sun Belt states—Texas, Arizona and Georgia—are also experiencing a slowdown. On the other hand, many Midwest states, including Illinois, Minnesota and North Dakota are gaining domestic appeal.
Sources: Census Bureau, SitusAMC Insights
Recent Trends from the SitusAMC Insights Dynamic Population Tracker
SitusAMC Insights’ proprietary Dynamic Population Tracker provides monthly updates across 51 metros using alternative gauges that measure population flows and dynamics well ahead of Census data. The tool discerns more recent trends and insights in population growth, filling in the data gap between the end of the Census collection period (July 1, 2025) and January 2026.
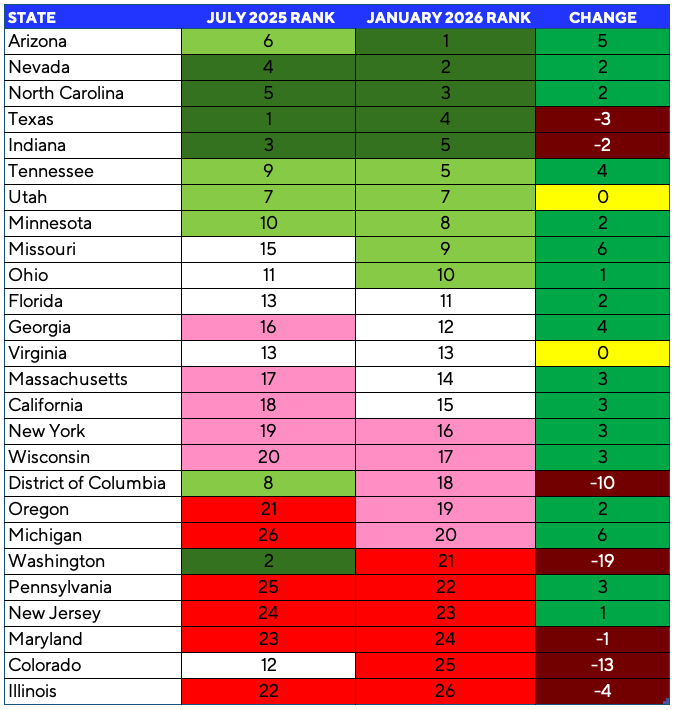
As of January 2026, some Sun Belt states, including Arizona, North Carolina and Texas, rank near the top in population growth, while Florida and Georgia have middling ranks. States that have struggled for the past few years, such as New York and California, are ranking closer to the median, as the return-to-office trend has helped recovery.
Over the past six months, Texas has experienced a decline in rank, evidence of slowing population growth. While Florida gained two spots, its population growth remains lackluster. Washington state and Colorado saw the largest rank decreases, down 19 and 13 places respectively. Washington houses a migrant detention center with a large number of detainees, which may be weighing on its population growth. Arizona, a state that benefitted from Covid-era in-migration, jumped from sixth to the top spot in our ranking.
The chart below shows a six-month comparison of overall ranks by state. State rankings represent the average ranking across the metros within each state. States that don't have one of the top 51 metros are not included.
Sources: Census Bureau, BLS, USPS, EIA, FDIC, Atlas, United Van Lines, Uhaul, SitusAMC Insights
Decelerating Population Growth Foreshadows Slowing Real Estate Markets
After shining brightly through the pandemic-era migration boom, the Sun Belt’s growth narrative—particularly in Florida and Texas—appears to be losing momentum. Population growth is slowing, and the outlook is further complicated by weakening international immigration. The U.S. Census Bureau projects international immigration will decline again in 2026, falling from already historic lows, and could even turn negative. If so, it would mark the first period of net negative migration in more than 50 years.
Because international immigration accounted for the majority of U.S. population growth over the last decade, a sustained decline would disproportionately affect states with large immigrant populations, including Florida, Texas and New York. Domestic migration trends also point to a waning advantage for Florida and Texas, both former hot spots for pandemic-driven relocation. However, SitusAMC’s Dynamic Population Tracker—based on higher frequency data than the Census—indicates improving momentum across much of the Sunbelt. Florida is a notable exception, currently exhibiting only moderate growth.
A slowdown in population growth has meaningful implications for both residential and commercial real estate. On the housing side, decelerating growth can reduce demand and place downward pressure on home prices and single-family rental rates, particularly in markets facing oversupply. New construction activity would likely pull back as pricing power weakens. Multifamily fundamentals are similarly sensitive: Slower inflows —or outflows—can dampen absorption, hurt rent growth and curtail new development. A broader cooling in housing demand would also ripple into the capital markets, reducing mortgage origination volumes and, by extension, servicing and securitization activity.
Population trends also underpin long-term demand across CRE sectors. Slower growth typically translates into weaker rental performance and valuation pressure across retail, office and industrial. Retail is especially exposed given its reliance on household formation and consumer spending; a downshift would be reflected in reduced demand for neighborhood centers, grocery-anchored retail and restaurants. Industrial fundamentals —including warehouse and last-mile distribution demand—are also tied to population density and metropolitan expansion. Even office demand is not immune, as labor force growth and household migration ultimately shape employment trends and space utilization.
Given the historical concentration of capital in high growth Sunbelt markets, the latest national and state-level population data may represent an early signal of shifting demographic tailwinds. If sustained, these patterns could reshape valuations, investment flows and financing activity across property types and geographies. SitusAMC Insights will continue to monitor these trends closely, supported by our proprietary population tracking tools.
For more information on SitusAMC Insight’s research, analytical tools or data products, visit our website. Our free, 24-page ValTrends report comes out on a quarterly. Subscribe to be notified as soon as the report is available, and we’ll send a link to download it for free.